
Without traces, model and prompt versions, tool spans and cost metrics, every incident stays guesswork.
I’ve spent four posts writing about principles: contracts, evals, tool safety, human oversight. All true - but how do I see in production whether any of it actually works?
Without structured observability, I don’t. A false success in the refund agent - the tool reports success, the customer waits for their money - can’t be found with application logs and error rates. Everything’s green. The system didn’t fail, it lied.
This post shows the observability infrastructure teams need when they run AI features live. Which questions do I need to be able to answer? What does a good trace look like? And where does my own setup stand?

Five questions before the tooling
How could I have debugged that in 30 seconds?
Not with grep in log files. Not with a dashboard showing me uptime and error rate - both were green. No error, no alert, just a wrong result.
Traditional metrics don’t catch AI-specific failures. False success, wrong tool selection or hallucinated actions stay invisible as long as I only look at HTTP status codes and exception counts. The problem sits deeper - in the agent’s decision logic and in how it interprets tool responses. Context gets lost between turns without a single log file pointing it out.
Before I talk about tooling, here are five questions every team should be able to answer.
1. Debugging: Why did the agent tell the customer X when Y happened?
The refund agent says “your refund’s gone out”. But refund_order returned an error - or was never even called. Without a correlated trace that includes tool call results, model inputs and model outputs, it’s guesswork. I need a chain: user input, routing decision, tool intent, tool result, generated answer. No gaps.
2. Cost: What does an average support case cost - and which agent path burns the most tokens?
Not every support case costs the same. A simple FAQ lookup costs a few hundred tokens. A refund flow with identity verification, order lookup and an approval loop can easily use twenty times that. Without token attribution per agent, tool and conversation, I only see a monthly bill - not where the money goes.
3. Latency: Where is the agent stuck - on the model call, the tool call or retrieval?
The user is waiting. But for what? For the model that takes 3 seconds to answer? For the lookup_order call running against a slow database? Or for a retrieval system gathering up context? Span-based latency breakdown isn’t a nice-to-have - it’s the only way to optimize deliberately instead of guessing.
4. Quality: How often does the agent pick the wrong tool? How often does it need several attempts?
The agent has four tools to choose from. How often does it reach for the right one? How often does it call lookup_order when it should have called verify_customer - and only corrects itself on the second try? Tool selection tracking and retry counts show me where the model is systematically off. These aren’t edge cases - they’re signals of prompt problems or missing tool descriptions.
5. Compliance: Can I trace the complete decision path for a specific customer case?
A customer calls and wants to know why their refund never arrived. Regulation demands traceability. I need an audit trail that shows: which agent called which tool when, which approval events happened, who approved what? Without that, every customer case is a black box.
Five questions, five different observability requirements. And yet in practice the same thing often happens: someone hooks up a tracing tool, a few spans get written - and then everyone hopes the right data will be in there somewhere.
Most teams aren’t missing tooling - they’re missing clarity about which operational questions they need to answer.
Anatomy of a trace
Five questions. No dashboard that answers them. Let’s change that.
Let’s take the refund agent and look at what a single support request produces as a trace - if we instrument it properly:
[ROOT] invoke_agent support-request
├── [LLM] chat gpt-5.4-nano (routing decision)
│   ├── gen_ai.usage.input_tokens: 674
│   ├── gen_ai.response.finish_reasons: ["tool-calls"]
│   └── gen_ai.response.model: gpt-5.4-nano
├── [TOOL] execute_tool lookup_order
├── [TOOL] execute_tool verify_customer
├── [EVENT] approval.requested (HITL pause)
│   └── wait_duration_ms, risk_level, tool_arguments
├── [EVENT] approval.granted (HITL resume)
│   └── approver_id, approval_id, justification
├── [TOOL] execute_tool refund_order (post-approval)
└── [LLM] chat gpt-5.4-nano (final answer)
    ├── gen_ai.usage.input_tokens: 4083
    ├── gen_ai.response.finish_reasons: ["stop"]
    └── gen_ai.response.model: gpt-5.4-nano
One trace, seven child spans. Each one answers a different question.
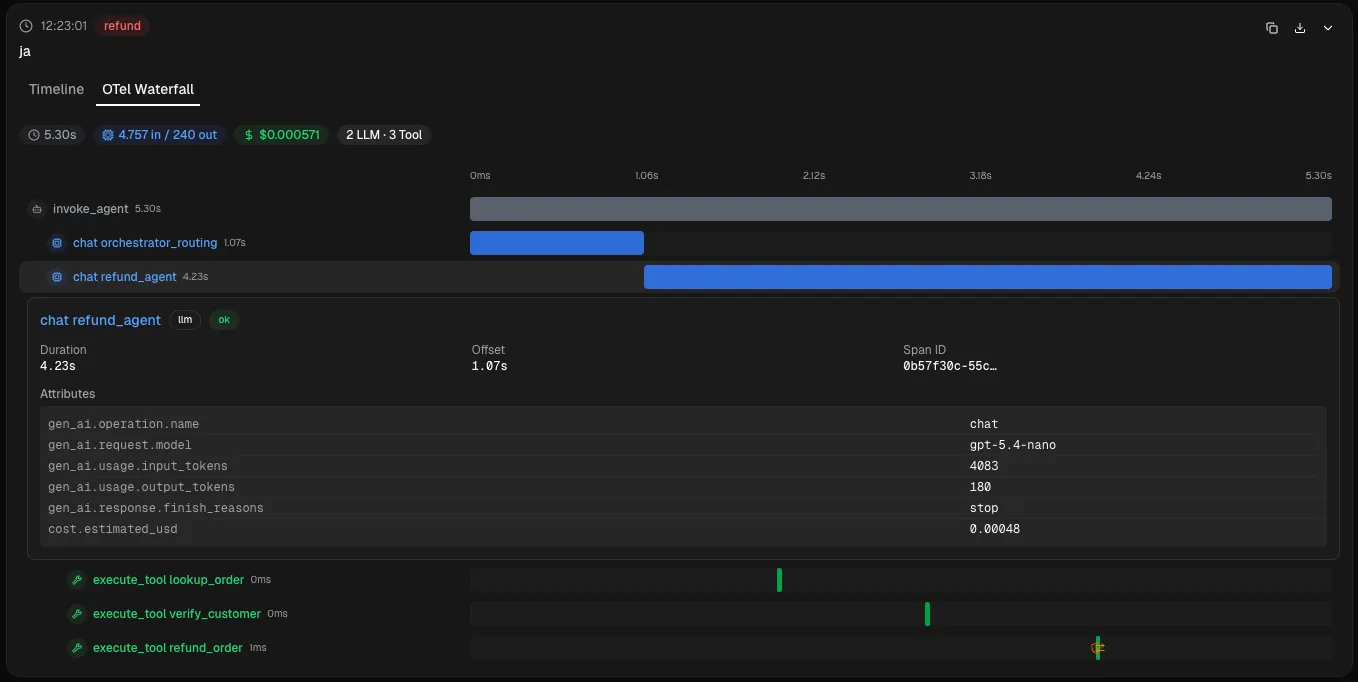
Let’s take a closer look.
Three span types, three perspectives
LLM calls (chat) are the model interactions. Every span carries token counts (gen_ai.usage.input_tokens, gen_ai.usage.output_tokens), the model that was actually used (gen_ai.response.model - not always the same as the one requested) and the finish reason. Three LLM calls in one request? That’s three cost items (question 2), three latency contributions (question 3), three potential sources of failure.
Tool executions (execute_tool) capture every tool call with its arguments and result. verify_customer took 40ms and returned valid: true? It’s in the span. refund_order failed with a timeout? That’s in the span too - and that gives me the answer to question 1: why did the agent confirm something to the customer that never happened?
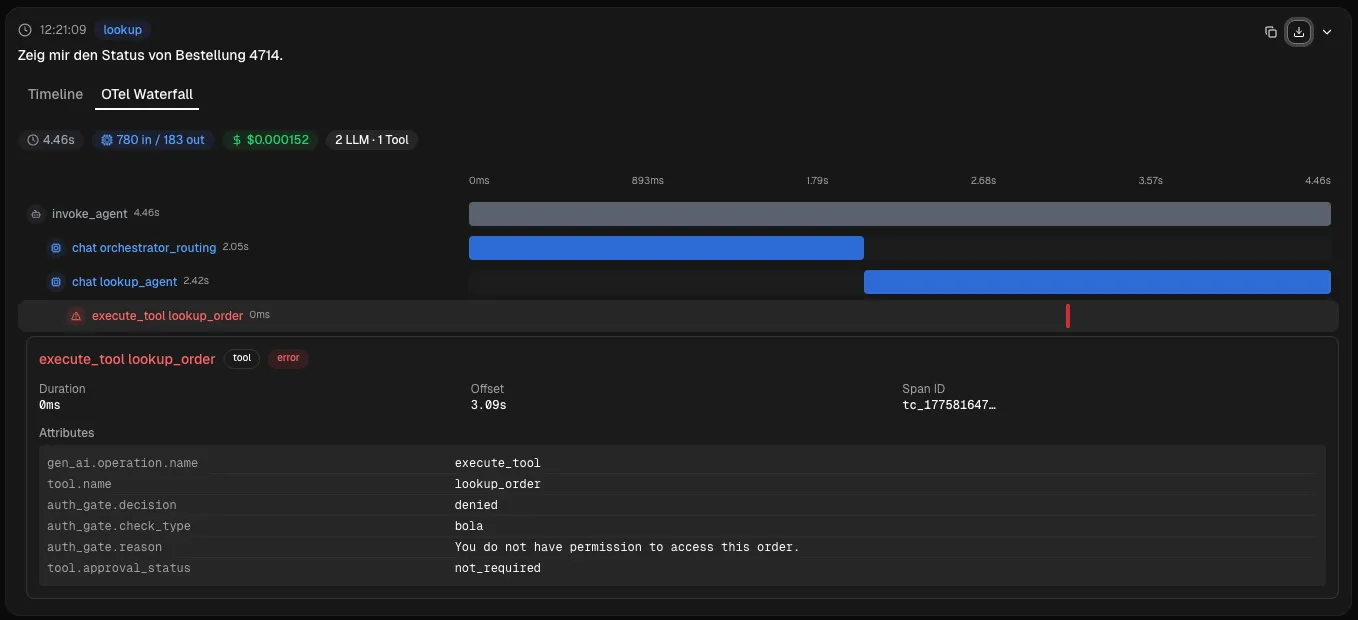
Agent orchestration (invoke_agent) is the root span - it holds everything together. Total duration, total cost, final status. If I want to know whether the refund agent is getting slower, I look here. If I want to know why, I look at the child spans.
Context propagation: who triggered what?
A trace without context is a data point without a coordinate system - technically correct, practically useless. The key question in an incident is never “What did the agent do?” but “What did the agent do for which customer in which ticket?”
OpenTelemetry baggage and root span attributes solve this: session.id, user.id, ticket.id travel through the entire trace as baggage. Every span inherits the context. If the refund agent refunded the wrong amount at 14:32, I find the complete trace via the ticket.id in seconds - not through log file archaeology.
Approval events in the trace
The HITL post was about the architecture of approval gates. This is about making them visible.

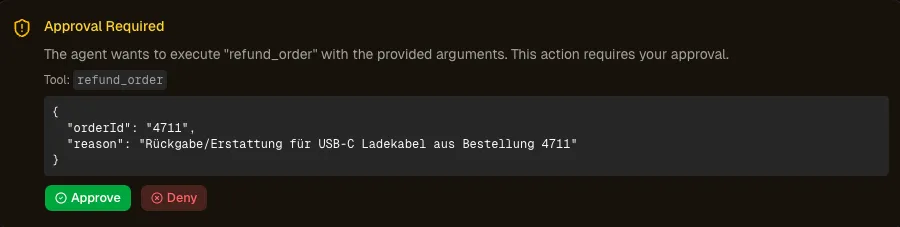
As of April 2026 there’s no standardized OTel convention for approval events. That means: custom events. approval.requested and approval.granted as span events on the root span, with attributes like wait_duration_ms, risk_level, approver_id and approval_id.
Why does that matter? Two metrics fall right out of it: approval latency (how long does the workflow wait for a human?) and approval rate (how often is something approved vs. rejected?). A rising rejection rate is a signal. Either the agent is proposing more and more questionable actions - or the approval criteria are too strict. I want to know either way.
What does NOT belong in the trace
AI workloads produce 10-50x more telemetry than classic services. Every LLM call has a prompt, a completion, often several tool calls with results. The temptation to log everything is strong.
Metadata and references are the default. Token counts, model version, finish reason, tool name, duration - yes. Full prompt text, API keys, raw customer feedback - no. Not because it’s technically impossible, but because it’s normally unnecessary.
Break-glass architecture: when you do need the full content
Sometimes metadata isn’t enough. A hallucination incident, an escalated customer case - that’s when I need the actual prompt and completion. The solution isn’t an either-or decision but a two-lane architecture:
Production lane: minimized events, only metadata and references. Long retention, low risk. That’s the normal state.
Break-glass lane: full content, activated by a named approver with a documented reason. Short retention (24-72h), automatic deletion, complete audit trail. Every access is traceable.
The pattern isn’t new - it’s the same principle as production database access or encryption key escrow. The difference: with AI workloads the data volume per request is so high that the default lane really has to be minimal for the break-glass lane to stay manageable at all.
What OpenTelemetry gives you - and what it doesn’t
Anyone working on observability for AI features runs into the OpenTelemetry GenAI semantic conventions. The spec exists, it’s growing, it has momentum. But it also has a problem: as of April 2026, not a single attribute is stable. Everything has the status “Development”. If you use the conventions today, you have to set OTEL_SEMCONV_STABILITY_OPT_IN=gen_ai_latest_experimental - and accept that attributes can be renamed at any time.
That doesn’t mean the spec is useless. It means we need to know what it can do - and above all, what it can’t. (A quick note on terms: the spec uses the status “Development”, but the opt-in variable is called experimental - a historical leftover. Same thing.)
What the spec covers
The conventions define span types for the most important operations: chat, text_completion, embeddings, execute_tool, invoke_agent, invoke_workflow. On top of that come core attributes like gen_ai.provider.name, gen_ai.request.model, token counts and finish reasons. On the metrics side there’s gen_ai.client.token.usage as a histogram, gen_ai.client.operation.duration and streaming metrics like gen_ai.server.time_to_first_token.
More recent additions are MCP conventions (mcp.method.name, mcp.session.id), agent spans (invoke_agent, invoke_workflow) and a gen_ai.evaluation.result event with score and label. It’s heading in the right direction.
What the spec doesn’t cover
The gaps are exactly the things that make the difference in production:
- Cost tracking: no
gen_ai.costattribute. The provider APIs return token counts, but no prices. Platforms like Langfuse or Helicone solve this with maintained price tables - but at the spec level, calculating cost is a problem you have to solve yourself. - Prompt versioning: no concept of prompt registries. Which version of the refund agent’s system prompt led to which result - not covered.
- User feedback: no standardized thumbs-up/down event. The link between a trace and a user rating doesn’t exist in the spec.
- Approval and HITL: no convention for pause/resume events. When a human stepped in and why - invisible.
- Guardrails: no event for content filtering or safety checks. Whether an output was filtered - not provided for.
The spec gives you the skeleton: model, provider, tokens, latency. Everything that turns AI features from a toy into a production system - cost, versions, feedback, governance - lives outside the conventions.
Deprecated attributes - what has already changed
If you started with the conventions early, you have to migrate: gen_ai.system is now gen_ai.provider.name, gen_ai.usage.prompt_tokens became gen_ai.usage.input_tokens, gen_ai.usage.completion_tokens became gen_ai.usage.output_tokens. A taste of what “Development” status means in practice.

The OTel GenAI conventions are a good starting point - but if you rely on the spec to cover all your observability requirements, production will surprise you.
The six most common mistakes in LLM observability
Observability for AI features is still young. But a few traps already keep showing up in post-mortems and engineering blogs. Six anti-patterns:
1. Log everything, correlate nothing
Application logs exist. Lots of them. Somewhere it says an LLM call happened. Somewhere else it says a tool was called. But which customer case does that belong to? Which agent step triggered the call?
Without trace IDs tying them together, logs are just noise with timestamps. When the refund agent confirms a refund that never arrived, I don’t want to search three different log streams - I want one trace that shows me the whole case.
2. Logging full prompts in production
As described in the trace section: content events should be opt-in, not opt-out. Still, teams often log everything - out of fear of missing something during an incident. The result: exploding storage costs and PII in the observability backend. The better question isn’t “What might we need?” but “Which metadata is enough for 95% of cases - and how do we get the rest when we need it?” The break-glass architecture sketched above solves exactly that.
3. Token counts without cost attribution
“We use 2 million tokens a day.” - “For what?” - Silence.
Global token counts are a number on a dashboard. Nothing more. Without metadata tagging on every API request - user_id, feature_name, agent_name - you can’t answer which feature drives the cost. Is it the refund agent? The summarization? The routing? Cost optimization without attribution is guessing.
4. Only instrumenting the happy path
This is the most dangerous mistake. Tool errors, retries, aborted chains - all invisible. The error rate looks fine because only successful completions get counted.
Do the math: 10 agent steps at 99% accuracy each come out at 90% overall accuracy. And every invisible retry multiplies cost and latency without anyone noticing. Error spans, retry counts and finish reason tracking belong on every step - not just the last one.
What you don’t measure, you don’t optimize. What you don’t see, you ignore - until it becomes an incident.
5. Observability as an afterthought
“We’ll build the features first, then the observability.” Sounds pragmatic. In practice it means: in your first incident you have no data. No trace, no span, no version information. Just assumptions.
Observability is an architecture decision, not an ops task for sprint 12. Trace context, span structure and metadata schema need to be in place before the first feature goes live. Instrumenting after the fact means breaking open all your abstractions after the fact.
Michael Seel takes the next step in “AI Systems Architecture: Governance”: observability doesn’t just belong in the team backlog but in the platform - otherwise you get shadow AI, just like shadow IT.

6. Dashboard cargo cult
Latency chart. Token count graph. Error rate gauge. Three dashboards, twelve panels, zero insights. Nobody looks at them until an incident happens - and then they don’t help, because they answer the wrong questions.
A dashboard showing “requests per minute” doesn’t answer a single operational question. What’s the hallucination rate? Which agent path costs the most? Is there prompt drift? Dashboards have to enable decisions, not decorate metrics.
Maturity model: from blind to diagnostic
There’s no official “LLM Observability Maturity Model” - no ISO standard, no Gartner Magic Quadrant PDF. But when I look at how Honeycomb, LangChain and Portkey describe the topic, a clear progression emerges. I’ve condensed it into five levels - not as an academic framework, but as an assessment grid for one question: Where are we, and what’s the next sensible step?
| Level | Name | Characteristics | Which of the five questions get answered |
|---|---|---|---|
| 0 | Blind | No traces, only application logs | None. Every incident is guesswork. |
| 1 | Basic | Request/response logging, token counts | Question 2 (cost) partially - but with no answer to where and why. |
| 2 | Structured | OTel traces with GenAI conventions, tool spans | Questions 1 (debugging), 3 (latency), 4 (quality). |
| 3 | Operational | Dashboards, alerts on cost/latency/error rate | Questions 1-4 proactively. Cost control. SLOs. |
| 4 | Diagnostic | Trace-to-eval pipeline, drift detection | All five questions - plus a feedback loop into the evals. |
Most teams are somewhere between level 0 and 1. Level 2 is the sensible next step.
That’s not a guess. If you have console.log("LLM response:", result) in production today, you’re at level 1. If you don’t even have that - level 0. Both mean: when something goes wrong, you guess instead of diagnosing.
Level 2 - structured traces with OpenTelemetry and the GenAI semantic conventions - is the point where debugging stops being a guessing game. Individual requests become traceable: which prompt went in, which model answered, which tools were called, how long each step took. That’s achievable with manageable effort - and it pays off from the first incident.
Level 3 needs more than tooling - it needs organizational maturity. Anyone can build dashboards. But defining meaningful alerts, writing SLOs for AI features, enforcing cost budgets per feature - those are decisions a team has to make together.
Level 4 is where observability and evals grow together. Production traces flow back into the eval pipeline. An incident doesn’t just get fixed, it gets locked in as a regression test. In the evals post I wrote that evals without production feedback go stale - level 4 closes exactly that gap.

Choosing your tooling: which setup fits?
“Which observability tool should I use?” - It depends. But not on features - on which layers you need to cover.
The two-layer model
Observability for AI features breaks down into two fundamentally different sets of questions:
Layer 1: infrastructure observability. Is the system healthy? How high is the latency? Where do requests break off? That’s OpenTelemetry’s domain - distributed tracing, metrics, logs. The GenAI semantic conventions extend OTel with LLM-specific attributes like gen_ai.usage.input_tokens or gen_ai.request.model. If you already have an OTel setup, you get the infrastructure view of your AI calls almost for free.
Layer 2: prompt-level observability. Is the AI producing good outputs? Which prompt version performs better? Where does the model hallucinate? OTel alone doesn’t answer these questions - for that I need a dedicated LLM platform with a prompt playground, eval pipelines and session tracking.
The two layers answer different questions. Squeezing both into one tool is a compromise in both directions.
Three scenarios
A team with OTel in the stack? Then the GenAI semantic conventions round out the infrastructure view, and Langfuse (or a comparable platform) sits on top for prompt-level observability.
Greenfield AI project? For startups: Langfuse Cloud, done. There’s no faster way in. For larger organizations: plan for OTel from day 1 - retrofitting it gets more expensive with every service. Plus an LLM platform for the second layer.
Compliance requirements? Then self-hosting is what counts. Langfuse is fully self-hostable and the clearest option. LangSmith and Braintrust offer self-hosting in their enterprise tier, but with more infrastructure overhead and less control. Helicone is open source and self-hostable as well. If you can’t let your data out of your hands, you have options - but the barrier to entry varies a lot.
Or: build it yourself?
Fair objection: with AI help, you could cobble together an observability stack like that in a few evenings. True - for layer 1. OTel SDK, Grafana Tempo or Jaeger as the backend, Grafana dashboards, a few custom span attributes for gen_ai.*. A cost table as JSON, prompt versions as a hash in the span. That’s not rocket science, and I’m the last person to talk you out of it - quite the opposite.
Layer 2 is the harder part. A prompt registry with a diff view between versions, eval pipelines with LLM-as-judge, session threading across long conversations, feedback capture with a UI for product and QA. That’s not “a few evenings” - that’s a platform of its own.
The pragmatic route: build layer 1 yourself, plug a platform in for layer 2. Langfuse can be connected to a self-built layer 1 stack via its OTel bridge - best of both.
Quick takes: Langfuse, Arize Phoenix, LangSmith, Helicone, Braintrust
Langfuse - The strongest open source all-round package. Self-hostable, an OTel bridge for connecting to your infrastructure, prompt management, eval pipelines. The community is growing fast and the platform increasingly covers both layers. For most teams the safest place to start.
Arize Phoenix - Best in class for RAG debugging and embedding analysis. Local-first, ideal for the development phase. If you work a lot with retrieval and want to understand chunk relevance, this is where you’ll find the best tools.
LangSmith - The natural fit for teams already working in the LangChain ecosystem. Deep integration, good developer experience. Self-hosting is available as an enterprise add-on, but it needs significant infrastructure (16+ vCPU, 64+ GB RAM). If you’re not tied to LangChain, there’s little reason to start here.
Helicone - Open source (MIT license) and self-hostable. The cloud version is the fastest way in, period: swap the proxy URL, done. Good for first insights into cost and latency. Self-hosting sidesteps the compliance problem of the proxy approach.
Braintrust - The strongest eval framework of the bunch. If you want to establish systematic evaluations as a core process, you’ll find the most mature tools here. Self-hosting in the enterprise tier as a hybrid model: data plane in your own account, control plane at Braintrust.
How it all fits together
This post doesn’t stand alone. It’s the logical consequence of everything I’ve written over the past few weeks - and it puts the concepts from the previous posts into operation:
- Contracts as the foundation - schema validation against the model output. In the observability world, that validation becomes a span attribute: did the schema match? When, where and how often did it not?
- Evals don’t just live in CI. Production traces become eval datasets - this is where the open thread “evals without production feedback go stale” gets tied off.
- Tool safety becomes tangible through tool spans. A false success - the tool reports success, but nothing happened - only becomes visible when the tool span carries the actual backend response as an event.
- Human-in-the-loop leaves approval events in the trace. And the rubber-stamp detection I described there as a design pattern? It becomes a metric: average review time, reject rate, approval without any change in context.
And for anyone who thinks observability is optional
The EU AI Act makes it mandatory.

Art. 12 requires “automatic recording of events” for high-risk systems - and it doesn’t mean console.log. Art. 12 requires that a deployer understands what the system did. Art. 14 calls for human oversight with the ability “to properly understand the relevant capacities and limitations of the high-risk AI system” - without traces, that requirement is hollow. Art. 19 prescribes a retention period of at least six months. And Art. 72 requires post-market monitoring - which is exactly the systematic analysis of production data this post describes.
EU AI Act - the relevant articles
- Art. 12 - Record-keeping: high-risk systems must automatically record events (logs) that ensure traceability over the system’s entire lifetime.
- Art. 14 - Human oversight: the people overseeing the system must be able to interpret its capabilities and limitations. That requires access to traces and metrics.
- Art. 19 - Retention: logs must be kept for at least 6 months.
- Art. 72 - Post-market monitoring: providers must systematically collect and analyze production data.
The deadline for high-risk obligations is August 2026. These articles form a regulatory chain that demands exactly the observability infrastructure described in this post. If you’re building it anyway, you have the technical foundation for compliance. If you’re not, you’ll have a problem soon.
Outlook: from traces to regression tests
The next logical step is the trace-to-eval pipeline. A production incident - a hallucinated amount, a false success, an overlooked edge case - becomes a trace. The trace becomes an eval dataset. The eval dataset becomes a permanent regression test in CI. No incident should happen twice in the same way.
Observability isn’t an ops topic. Without it, contracts, evals and human oversight remain concepts I can’t see when they break.